4719 W Richardson St
Run June 19, 2026 · via boise-home-eval skill · rate 6.5% (Freddie 6.47% 6/18, Bankrate 6.48% 6/19/2026) · cash fund $105k
Listing facts (Zillow, MLS #98989154)
- Source: https://www.zillow.com/homedetails/4719-W-Richardson-St-Boise-ID-83705/72685312_zpid/
- List price: $444,900 (price cut $5K on 6/19)
- 3 bd / 1 ba · 1,127 sqft · built 1951 · lot 8,276 sqft (0.19 ac) · no HOA · ~$395/sqft
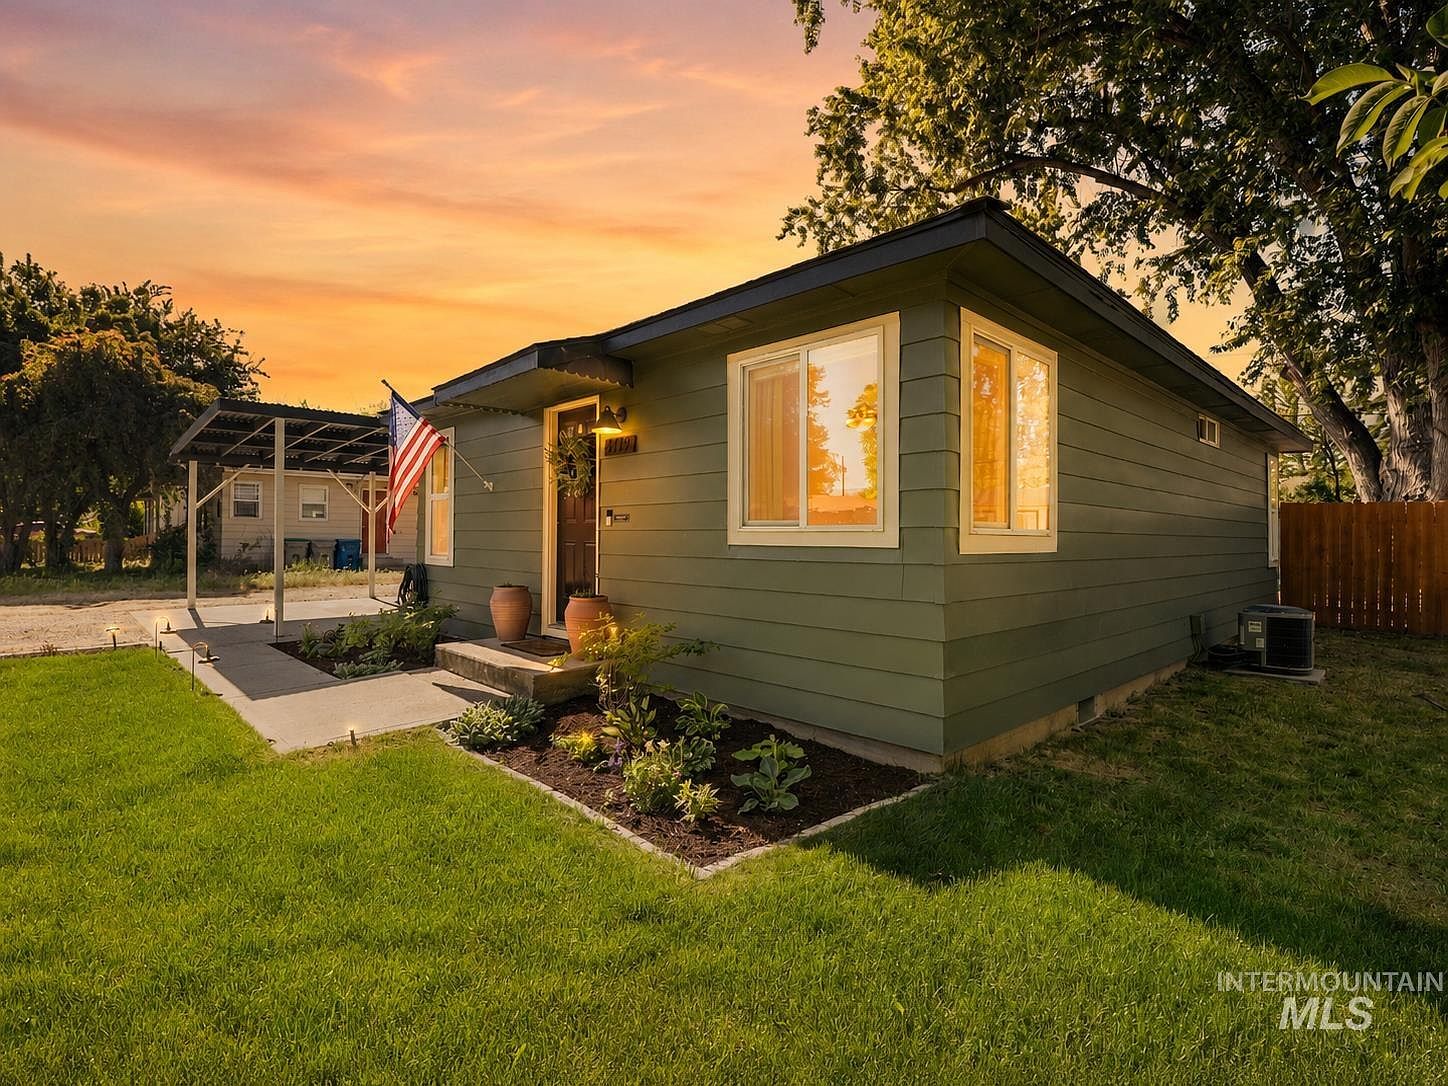
- Single-level · RV parking, garden shed, quartz countertops, updated vinyl windows, mature trees. 37 photos.
County record — Ada County Assessor (the truth)
- Parcel: R7442000140 · Subdivision: RICHARDSON SUB AMD · Zone R-2 · 0.188 ac · Tax Code Area 01-6
- Owner of record: DOENCH ALEXANDER J (a person; Instrument #2023038033, held since 2023)
- 2026 assessed value: $369,500 — land $219,500 (MARKET) + dwelling $150,000 (COST)
- List price is ~$75,400 (20%) OVER assessed value — a wide gap. The 2026 assessment actually DROPPED from 2025’s $388,400; list is well above either. Push on why (recent updates? optimistic pricing?).
Valuation history by year (no Idaho cap — taxes drift with these)
| Year | Assessed |
|---|---|
| 2026 | $369,500 |
| 2025 | $388,400 |
| 2024 | $364,200 |
| 2023 | $347,200 |
| 2022 | $410,400 |
| 2021 | $317,000 |
| 2020 | $246,300 |
Actual property tax history (Total Taxes billed)
| Year | Total Taxes |
|---|---|
| 2025 | $2,427.66 |
| 2024 | $2,170.60 |
| 2023 | $2,121.84 |
| 2022 | $2,474.62 |
| 2021 | $2,098.44 |
| 2020 | $1,736.92 |
Exemption already applied. 2025 bill $2,427.66 ≈ ($388,400 − $125k) × 0.92% (resident owner). Eric inherits roughly this bill (~$2,423/yr ≈ ~$202/mo). FILE FOR THE EXEMPTION in your own name after closing.
Affordability — VERDICT: OVER target on payment
Assumptions: 6.5% 30-yr fixed, 20% down (no PMI), effective levy 0.92%, $125k exemption applied, ins ~$110/mo.
20% down (no PMI)
- 20% down = $88,980 → loan $355,920
- P&I at 6.5%: ~$2,250/mo
- Property tax (exemption applied): ~$202/mo
- Insurance: ~$110/mo · HOA $0 · PMI $0
- All-in: ~$2,562/mo → ~$62/mo OVER the $2,500 target. ✗
Cash: $88,980 down + ~$13,347 closing (3%) ≈ $102,327 — inside the $105k fund, but leaving only ~$2.7k. Both payment and cash are uncomfortable.
Flags
- List ~20% over the county’s $369,500, and the 2026 assessment fell vs. 2025 — the widest list-vs-assessed gap in this batch alongside the over-payment. Strong reason to negotiate or pass.
- 3 bd / 1 ba, 1,127 sqft, built 1951 — single bath limits livability/resale; verify the updates’ scope.
- Cash cushion only ~$2.7k after 20% down + closing — essentially nothing left inside the fund.
- At $395/sqft it’s near the top of the batch on a per-foot basis.
Bottom line
Lands ~$62/mo over the $2,500 payment target AND drains the cash fund to ~$2.7k — and the list is ~20% above the county’s $369,500 (with the 2026 assessment having dropped). On numbers alone this is a pass unless the price comes down meaningfully; the recent $5K cut isn’t enough.